
Understanding Candlestick Charts:100% A Comprehensive Guide
Introduction to Candlestick Charts
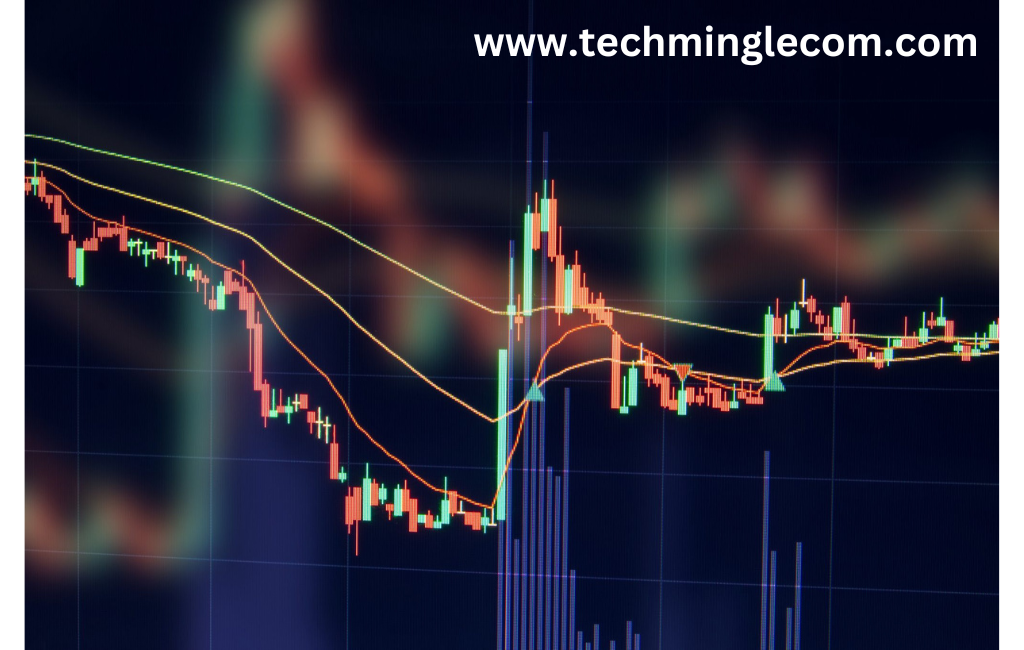
Candlestick charts are a powerful tool used by traders to analyze and predict market movements. They provide a visual representation of price action over a specific period and are valued for their ability to convey complex data in an easily interpretable format. Whether you’re a seasoned trader or just starting, understanding candlestick charts can significantly enhance your trading strategy.
History of Candlestick Charts
Candlestick charts have their origins in Japan, dating back to the 18th century. They were initially used by rice traders to track market prices and trading patterns. The method was later introduced to the Western world by Steve Nison, who recognized their potential in modern trading.
Basics of Candlestick Charts
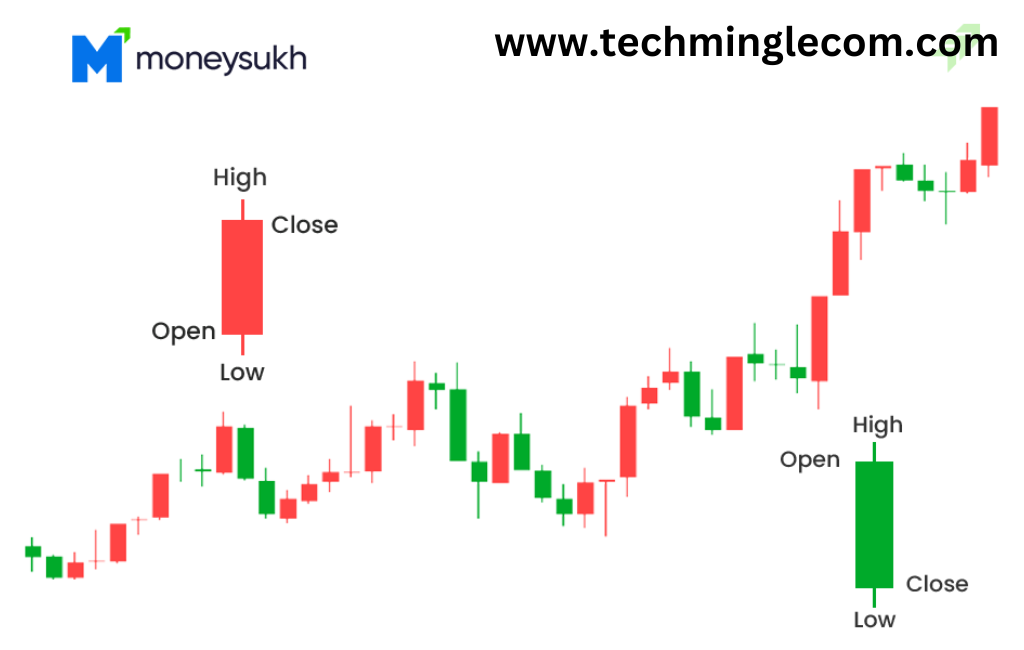
At its core, a candlestick chart consists of individual candles that represent the price movement within a specific time frame. Each candlestick displays four key components:
- Open: The price at which trading begins for the specified period.
- Close: The price at which trading ends for the specified period.
- High: The highest price during the period.
- Low: The lowest price during the period.
Types of Candlesticks
Candlesticks in trading charts are essential tools that depict the price movements of an asset over a specified period. Understanding the different types of candlesticks and their implications can help traders make informed decisions.
Bullish Candlesticks
Bullish candlesticks indicate that the price of an asset has increased over the chosen time frame. These candlesticks are often green or white.
- Bullish Candlestick:
- This type of candlestick has a closing price that is higher than the opening price, indicating buying pressure.
- Hammer:
- A small body with a long lower shadow, indicating a potential reversal from a downtrend to an uptrend.
- Bullish Engulfing:
- A pattern where a smaller bearish candle is followed by a larger bullish candle that engulfs the previous one.
Bearish Candlesticks
Bearish candlesticks indicate that the price of an asset has decreased over the specified period. These candlesticks are typically red or black.
- Bearish Candlestick:
- This type has a closing price that is lower than the opening price, indicating selling pressure.
- Hanging Man:
- Similar in appearance to the hammer, but it appears after an uptrend, indicating a potential reversal to a downtrend.
- Bearish Engulfing:
- A small bullish candle followed by a larger bearish candle that completely engulfs it.
Doji Candlesticks
Doji candlesticks have an opening and closing price that are very close or equal, indicating indecision in the market.
- Standard Doji:
- Appears when the open and close prices are virtually the same, signaling indecision or a potential reversal.
- Long-legged Doji:
- Features long upper and lower shadows, indicating significant market volatility and indecision.
- Dragonfly Doji:
- A type of Doji with a long lower shadow and no upper shadow, suggesting a potential bullish reversal.
- Gravestone Doji:
- A Doji with a long upper shadow and no lower shadow, indicating a potential bearish reversal.
Spinning Top Candlesticks
Spinning top candlesticks have small bodies and long shadows on both sides, representing indecision and potential market reversal.
- Bullish Spinning Top:
- Indicates a minor bullish trend with equal buying and selling pressure.
- Bearish Spinning Top:
- indicates a minor bearish trend with equal buying and selling pressure.
Marubozu Candlesticks
Marubozu candlesticks lack shadows and have a strong body, representing strong buying or selling pressure.
- Bullish Marubozu:
- Has no shadows and a strong bullish body, indicating strong buying pressure.
- Bearish Marubozu:
- Features no shadows and a strong bearish body, suggesting strong selling pressure.
Reading Candlestick Patterns
Candlestick patterns can be single or multiple candles that provide insight into market sentiment. Single candlestick patterns are simpler and easier to recognize, while multiple candlestick patterns offer more complex signals.
Single Candlestick Patterns
- Doji:
- Indicates indecision in the market.The opening and closing prices are nearly identical.
- Hammer:
- A bullish reversal pattern that forms after a downtrend, characterized by a small body and a long lower shadow.
Multiple Candlestick Patterns
- Engulfing Pattern:
- A two-candlestick pattern where a smaller candlestick is followed by a larger one that entirely engulfs the body of the previous candle.
- Morning Star:
- A bullish three-candlestick pattern that signals a potential reversal after a downtrend.
Common Candlestick Patterns
Hammer and Hanging Man
- Hammer:
- Indicates a potential reversal from a downtrend to an uptrend. It has a small body and a long lower shadow.
- Hanging Man:
- Similar to the hammer but occurs after an uptrend, indicating a potential reversal to a downtrend.
Engulfing Patterns
- Bullish Engulfing:
- A small bearish candle followed by a larger bullish candle that engulfs the previous one.
- Bearish Engulfing:
- A small bullish candle followed by a larger bearish candle that completely encompasses the previous candle.
Morning and Evening Star
- Morning Star:
- A bullish pattern consisting of three candles: a long bearish candle, a short-bodied candle, and a long bullish candle.
- Evening Star:
- A bearish pattern that is the opposite of the morning star.
Interpreting Candlestick Patterns
Understanding candlestick patterns is essential for making informed trading decisions. Each pattern tells a story about market sentiment and potential future movements. Here’s a guide on how to interpret various candlestick patterns effectively:
Single Candlestick Patterns
- Doji
- Description:
- A Doji forms when the opening and closing prices are almost identical.
- Interpretation:
- It signifies indecision in the market. If it appears after a significant trend, it could indicate a potential reversal.
- Hammer
- Description:
- A small body at the top with a long lower shadow.
- Interpretation:
- This pattern suggests a bullish reversal if it appears following a downtrend.The long lower shadow shows that sellers drove prices down, but buyers pushed them back up.
- Hanging Man
- Description:
- Similar to the Hammer but appears at the top of an uptrend.
- Interpretation:
- Suggests a potential bearish reversal. It indicates that sellers have begun to enter the market, potentially ending the uptrend.
- Spinning Top
- Description:
- Small body with long upper and lower shadows.
- Interpretation:
- Represents indecision and potential market reversal.
Multiple Candlestick Patterns
- Engulfing Pattern
- Bullish Engulfing:
- Description:
- A small bearish candle followed by a larger bullish candle that engulfs the previous one.
- Interpretation:
- Indicates a potential bullish reversal, suggesting that buyers have taken control.
- Bearish Engulfing:
- Description:
- A small bullish candle followed by a larger bearish candle that completely engulfs it.
- Interpretation:
- Signals a potential bearish reversal, indicating that sellers are overpowering buyers.
- Bullish Engulfing:
- Morning Star
- Description:
- A three-candle pattern with a long bearish candle, a short-bodied candle, and a long bullish candle.
- Interpretation:
- Indicates a bullish reversal. The pattern suggests that the downtrend is losing momentum and buyers are gaining strength.
- Evening Star
- Description:
- The opposite of the Morning Star, with a long bullish candle, a short-bodied candle, and a long bearish candle.
- Interpretation:
- Signals a bearish reversal. It shows that the uptrend is weakening, and sellers are beginning to dominate.
- Three White Soldiers
- Description:
- Three consecutive bullish candles with progressively higher closes.
- Interpretation:
- Indicates strong bullish momentum and a continuation of the uptrend.
- Three Black Crows
- Description:
- Three consecutive bearish candles with progressively lower closes.
- Interpretation:
- Signals strong bearish momentum and a continuation of the downtrend.
Contextual Analysis
Interpreting candlestick patterns effectively requires considering the broader context:
- Trend Analysis
- Current Trend:
- Identify the prevailing trend before the appearance of the candlestick pattern.
- Pattern Placement:
- Patterns are more significant when they appear at key points, such as the end of a trend.
- Volume Confirmation
- High Volume:
- Patterns that appear with high trading volume are more reliable.
- Low Volume:
- Patterns on low volume might indicate weak market sentiment.
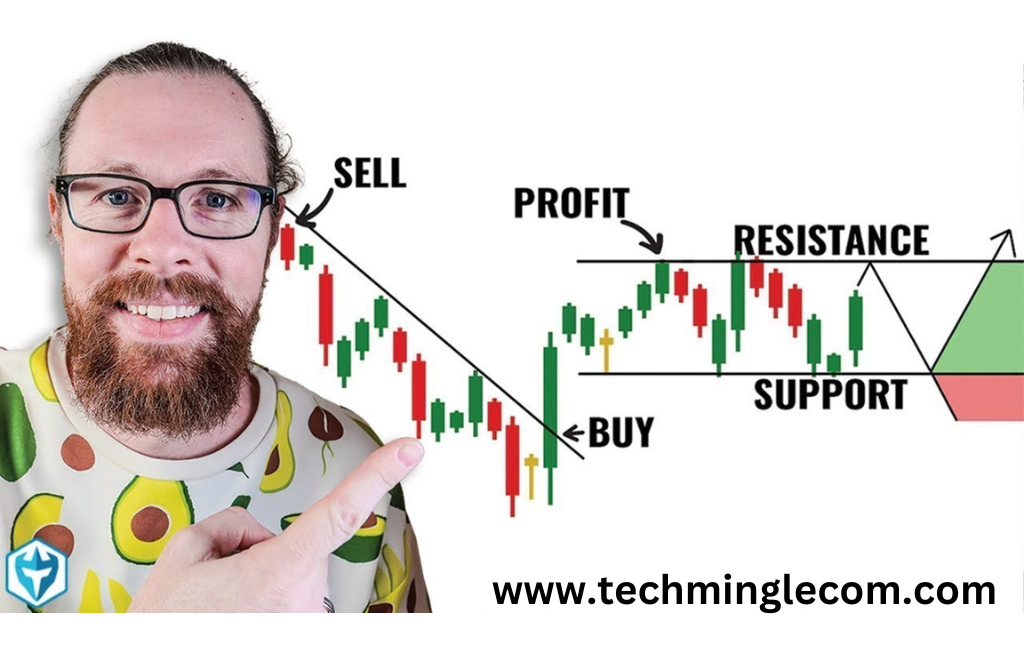
- Support and Resistance Levels
- Support:
- Bullish patterns near support levels are more likely to signal a reversal.
- Resistance:
- Bearish patterns near resistance levels are more likely to indicate a reversal.
- Other Technical Indicators
- Moving Averages:
- Confirm patterns with moving averages to identify potential trend changes.
- Relative Strength Index (RSI):
- Use RSI to identify overbought or oversold conditions that align with candlestick patterns.
Candlestick Chart Strategies
Swing Trading
Swing traders use candlestick patterns to identify short to medium-term trends, allowing them to capitalize on price swings.
Day Trading
Day traders rely on candlestick charts for quick decision-making, using patterns to predict intraday price movements.
Advantages of Candlestick Charts
Candlestick charts are popular because of their visual appeal and ability to quickly convey market sentiment. They help traders make informed decisions by providing clear signals of potential market reversals and continuations.
Limitations of Candlestick Charts
Despite their advantages, candlestick charts have limitations. They can be subjective, and their effectiveness often depends on the trader’s experience.Additionally, they should be used alongside other technical analysis tools rather than in isolation.
Candlestick Chart Tools
Several software and platforms offer candlestick charting tools, including MetaTrader, TradingView, and Thinkorswim. These platforms allow traders to customize their charts and apply various indicators for more comprehensive analysis.
Case Studies
Successful Trades
- Apple Inc. (AAPL):
- In 2020, a bullish engulfing pattern signaled a strong uptrend, leading to significant gains for traders.
Failed Trades
- Tesla (TSLA):
- In 2021, a misinterpreted evening star pattern resulted in losses for some traders, highlighting the need for confirming signals.
Advanced Candlestick Patterns
Three-line Strike
A bullish reversal pattern consisting of three bearish candles followed by a larger bullish candle that closes above the first candle’s open.
Three Black Crows
A bearish pattern where three consecutive bearish candles indicate a potential downtrend.
Candlestick Charts and Market Psychology
Candlestick patterns reflect market psychology, showing how emotions drive market movements. Traders can use these patterns to predict future behavior by understanding the underlying sentiment.
Conclusion
Candlestick charts are an invaluable tool for traders, offering a visual and intuitive way to analyze market movements. By understanding and interpreting various candlestick patterns, traders can make more informed decisions and improve their trading strategies.
FAQs
What are candlestick charts used for?
Candlestick charts are used to represent price movements in financial markets, helping traders identify trends and potential reversals.
How reliable are candlestick patterns?
While candlestick patterns can be reliable indicators, they should be confirmed with other technical analysis tools for better accuracy.
Can beginners use candlestick charts effectively?
Yes, beginners can use candlestick charts effectively with proper education and practice.
What are the best resources to learn about candlestick charts?
Books like “Japanese Candlestick Charting Techniques” by Steve Nison and online platforms like Investopedia offer excellent resources.
How do candlestick charts compare to other chart types?
Candlestick charts provide more information and visual cues compared to line or bar charts, making them a preferred choice for many traders.